Verdict Research
We graded the reviewers: the same product swings 0.66 points depending on who reviews it.
By Mike Hunter · First published June 16, 2026 · Rebuilt October 20, 2026 on printed scores only · Methodology at the bottom
We aggregate professional review scores for a living, which means we can see the same product through several reviewers' eyes at once. So we asked: do review outlets actually grade on the same curve? We compared 3,150 scores exactly as the outlets printed them across 859 products that two or more outlets reviewed. They don't. The outlet you happen to read can move a product's score by more than half a point, and two sites owned by the same publisher can sit two full stars apart on the same mouse.
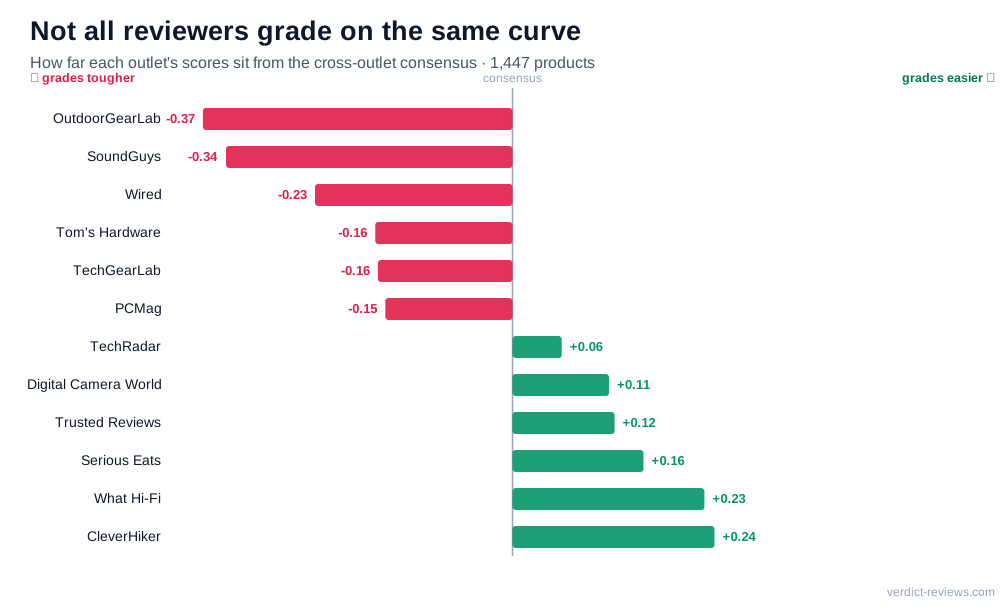
Reviewers don't grade on the same curve
To compare outlets fairly, we can't just rank them by average score — an outlet that mostly reviews premium flagships would look artificially generous. Instead, for every product we compute the consensus (the average score across all outlets that reviewed it), then measure how far each outlet lands above or below that consensus on the products it covers. That difference is its grading bias. Across the 15 outlets with at least 20 scored products on a native scale, the spread runs from 0.29 points below consensus (SoundGuys) to 0.37 above (What Hi-Fi), a 0.66-point swing on a 5-point scale that depends entirely on who's holding the pen.
The toughest and most generous graders
Bias is each outlet's average distance from the per-product consensus — negative means it scores tougher than its peers, positive means easier. “Avg” is its raw average score on a 5-point scale; “n” is how many products it scored.
Grade hardest
- SoundGuys-0.29 · 3.79 avg · n=49
- Wired-0.21 · 3.77 avg · n=26
- Tom's Hardware-0.14 · 3.94 avg · n=81
- PCMag-0.09 · 4.01 avg · n=172
- GearJunkie-0.06 · 4.06 avg · n=30
- PCWorld-0.04 · 4.02 avg · n=49
Grade easiest
- What Hi-Fi+0.37 · 4.74 avg · n=31
- CleverHiker+0.34 · 4.51 avg · n=55
- BetterTrail+0.15 · 4.42 avg · n=33
- TechRadar+0.10 · 4.24 avg · n=177
- CNET+0.07 · 4.22 avg · n=35
- Digital Camera World+0.06 · 4.42 avg · n=42
Not ranked: OutdoorGearLab (-0.38, n=106) and TechGearLab (-0.28, n=78). Both print a /100 score graded on a curve within each test group, so a straight conversion to stars would make them look harsher than they are.
The same product, a full grade apart
On 27% of products, the outlets we track are a full point or more apart, and these aren't obscure picks. Several of the widest splits are between sister sites: TechRadar, Tom's Guide, Tom's Hardware and What Hi-Fi are all owned by Future plc, and they still land as much as two stars apart on the same product. Every score below links to the review it came from.
| Product | Liked it | Less sold |
|---|---|---|
| Razer DeathAdder V3 Pro Gaming Micesame owner | TechRadar 5/5 | Tom's Guide 3/5 |
| Sony PS-LX3BT Turntables Under $500same owner | What Hi-Fi 5/5 | TechRadar 3/5 |
| Shokz OpenRun Pro 2 Wireless Running Headphones Under $200same owner | TechRadar 4.5/5 | What Hi-Fi 3/5 |
| Bowers & Wilkins Px8 Noise Cancelling Headphones | What Hi-Fi 5/5 | PCMag 3.5/5 |
| Wyze Scale X Smart Scales | PCMag 4.5/5 | Tom's Guide 3/5 |
| Sabrent Rocket Nano V2 External SSD Enclosures | PCWorld 4.5/5 | Tom's Hardware 3/5 |
| Netgear Orbi 870 Wifi 7 Routers | Trusted Reviews 4.5/5 | Tom's Hardware 3/5 |
Why this happens — and why aggregation fixes it
None of these outlets is “wrong.” Different test benches, house styles, and audiences produce different scores: a headphones specialist weighs sound the way a general-tech site never would, and some publications simply grade on a stricter curve. The problem is for the reader, because a single review — generous or harsh — can swing a buying decision. Averaging across outlets cancels out each one's individual bias, which is the entire premise of Verdict.
What this means if you're buying
Don't let one review — high or low — decide it for you. Check whether the outlet you're reading tends to grade soft or hard, and look at where a product lands across several reviewers. Our category rankings do exactly that — every score is an average across the publications that tested it. See also our companion study on whether price predicts quality (it barely does).
Methodology & data
Rebuilt 2026-10-20 from Verdict's database. Only scores the outlet printed itself count: its structured data (JSON-LD or microdata) or the score shown in the review text. Numbers that an AI model inferred from a review's wording or from a video were left out, as were retailer and manufacturer ratings. That leaves 3,150 scores, converted linearly to a 5-point scale (a 6/10 becomes 3/5). For each of the 859 products with two or more scores we take the consensus (the mean across its outlets). An outlet's grading bias is the average of (its score − that product's consensus) over every product it scored. The leaderboard includes outlets with 20 or more scored products. The 0.66-point figure is the range between the lowest and highest bias among them, excluding OutdoorGearLab and TechGearLab, whose curved /100 scores don't convert cleanly. Named splits use only scores between 3 and 5, and each was checked against the outlet's live page on 2026-10-20.
Download every score (CSV) with its outlet, original scale, source type and the URL it came from. Free to reuse with a link back. Found a score that doesn't match the outlet's page? Tell us and we'll fix it. Full ranking methodology: Verdict methodology.