Verdict Research
The best product is rarely the priciest. We checked 296 categories.
By Mike Hunter · July 2, 2026 · Methodology at the bottom
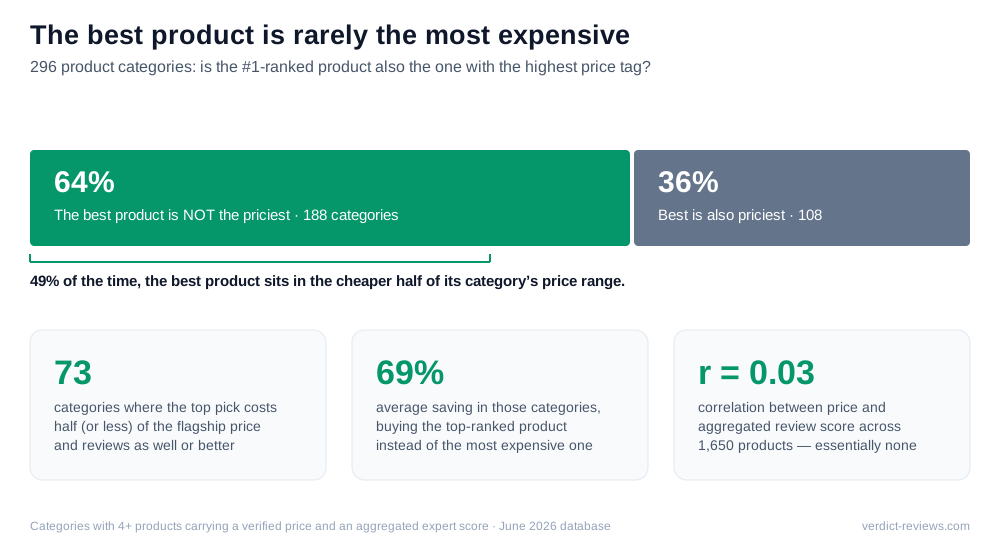
Every sale season — July 4th, Prime Day, Black Friday — the loudest discounts hang off the most expensive products, as if the flagship were automatically the thing worth wanting. So we asked our database a blunt question: in how many categories is the top-ranked product actually the most expensive one? Across 296 product categories where we track at least four products with verified prices and aggregated expert scores, the answer: almost never a given. In 64% of categories, the best product is not the priciest — and about half the time it sits in the cheaper half of its category's price range.
Same score or better, half the price
The starkest version of the pattern: in 73 categories, the top-ranked product costs half or less of what the category's most expensive product costs — while reviewing as well or better. Buying the best instead of the priciest in those categories saves 69% on average. A few hand-checked examples:
| Category | Top-ranked pick | Category flagship |
|---|---|---|
| Charcoal grills | Weber Original Kettle Premium 22″ $219 · 4.8/5 | Kamado Joe Classic III $2,199 · 4.8/5 |
| Electric scooters | Segway Ninebot E3 Pro $300 · 4.5/5 | Nami Klima $1,999 · 3.7/5 |
| Portable power stations | Bluetti AC70 $359 · 4.5/5 | Jackery Solar Generator 2000 $1,499 · 4.4/5 |
| Robot vacuums | Mova P10 Pro Ultra $359 · 4.3/5 | Dreame X60 Max Ultra $1,700 · 4/5 |
| OLED TVs | Samsung S90D $1,000 · 4.3/5 | Sony Bravia 8 $2,298 · 4/5 |
The cheap champions: under $100 and already the best
The pattern isn't only about skipping four-figure flagships. Plenty of category winners are inexpensive outright — 120 products under $100 rank first or second in their category with a 4.4+ aggregated score. These don't need a sale to be worth buying:
| Product | Category (ranked #1) | Price | Score |
|---|---|---|---|
| Bosch ICON wiper blades | Windshield wipers | $31 | 4.8/5 |
| Lutron Caséta Smart Dimmer PD-6WCL | Smart light switches | $65 | 4.8/5 |
| Kasa Matter Smart Plug KP125M | Smart plugs | $30 | 4.7/5 |
| Sawyer Squeeze Water Filtration System | Backpacking water filters | $34 | 4.7/5 |
| iOttie iTap 3 Magnetic Mount | Car phone mounts | $18 | 4.7/5 |
| Meguiar's Ultimate Liquid Wax | Car wax | $29 | 4.7/5 |
Why sale-season pricing misleads
Discount marketing anchors on the list price: “$700 off the flagship” reads as a bigger win than “$40 off the thing reviewers actually ranked first.” But price and review quality are barely related — across the 1,650 products in this analysis, the correlation between price and aggregated expert score is r = 0.03, statistically indistinguishable from none. (Our earlier study, Does a higher price buy a better product?, found the same flat line from the product side.) A deep percentage cut on an over-priced product still buys you an over-priced product.
How to use this when the deals start
- Start from the ranking, not the discount. Find what independent reviewers ranked first in the category, then check whether that product is discounted — not the other way around.
- Ignore the “was” price. Percentage-off framing is anchored to list prices that the best products often never carried in the first place.
- Check the cheap half first. Half the time, the best product in a category is already in the cheaper half of its price range — before any sale.
The aggregated rankings behind these numbers are free to browse in the category index.
Methodology & data
Figures come from Verdict's database as of June 2026: 296 categories with four or more products carrying both a verified price and an aggregated expert review score (1,650 products total; price-flagged entries excluded). “Top-ranked” is the #1 product in our aggregated ranking. “Cheaper half” means the top-ranked product's price is at or below the category's median price. The 73 half-price categories require the top pick to cost no more than 50% of the category's most expensive product while matching or beating its score. Correlation is Pearson's r on log price vs. aggregated rating. Prices are point-in-time; named examples were individually re-checked and price-extraction outliers excluded. Full ranking methodology: Verdict methodology. Questions or want the underlying numbers? Get in touch.